0.この記事の結論
pcasteran/terraform-graph-beautifier: Terraform graph beautifier が個人的にはおすすめ!やはり、Terraform にビルトインされた terraform graph を input 値としているせいか、安定している印象を受けた。
im2nguyen/rover: Interactive Terraform visualization. State and configuration explorer. もとくにビジュアル面でよかった。ただし、Docker で扱う場合、Docker ホスト側の Terraform のバージョンによってはうまく動かないことがあったので、2番目におすすめとしたい。
1.この記事を書こうと思った背景
terraform graph という Terraform のリソース可視化ツールがある。これは Terraform にビルトインされたコマンドのひとつであり、Terraform で表現するインフラリソースの可視化ツールのひとつである。
詳細な使い方は以下の Terraform のドキュメントを参照してほしい。
Command: graph | Terraform by HashiCorp
そんな terraform graph だが、リソースが多いと見にくいという欠点がある。そこで、表題のとおり、terraform graph よりビジュアライズな Terraform のインフラリソース可視化ツールを探すことにした。
1-1.可視化する Terarform のサンプルコード
今回、可視化する Terarform のサンプルコードは、以下の「7.サンプルコード」で書いているものとする。
7.サンプルコード | 複数の AWS Lambda のエラーを CloudWatch Alarms で検知できるように Terraform で定義する | gkzz.dev
1-2.Terarform のサンプルコードを terraform graph で可視化した(比較材料として)
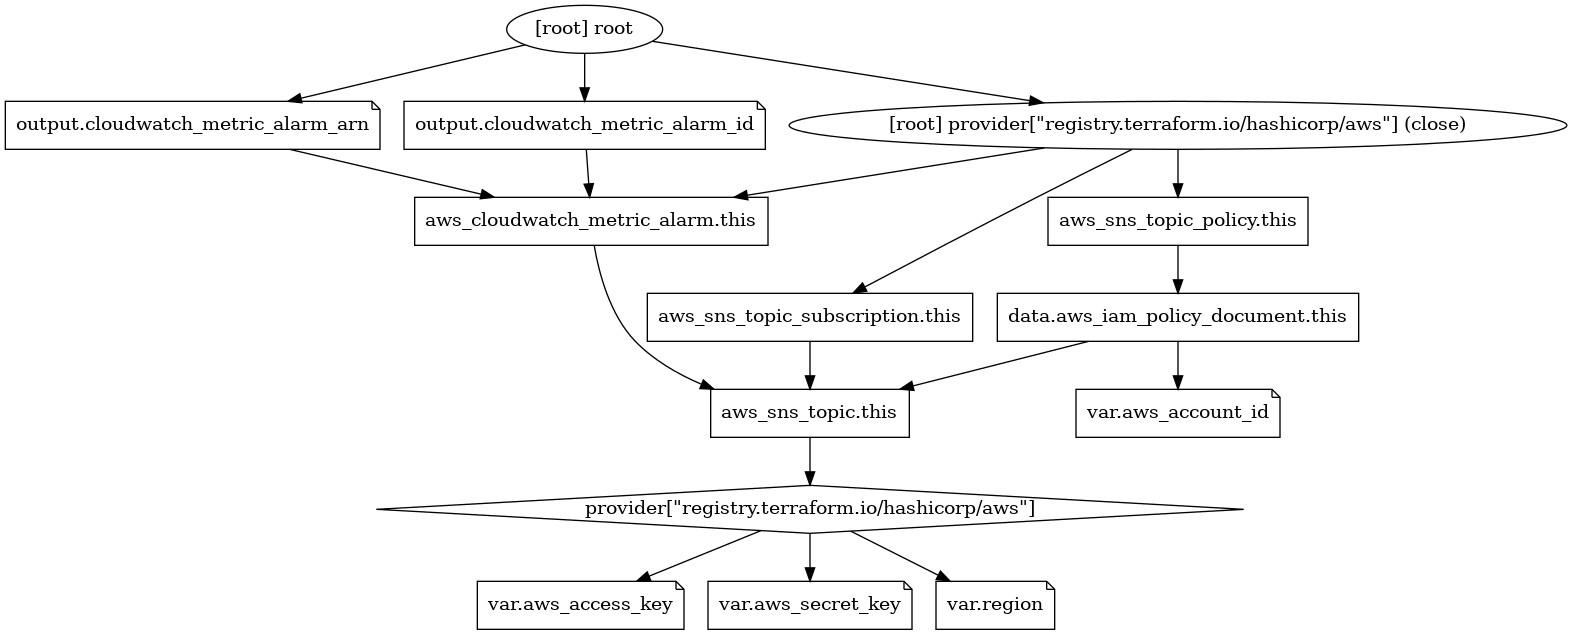
terraform graph と代替ツールとを比較するため、上述したサンプルコードを terraform graph | dot -Tpng > graph.png で可視した様子を紹介したい。リソースが少なくてもモノクロであるところが気になってしまう。
それでは、どのような可視化ツールがあるか、探していこう!
2.Terraform graph beautifier(おすすめ!)
pcasteran/terraform-graph-beautifier: Terraform graph beautifier
2-1.使い方
参考:#installation | pcasteran/terraform-graph-beautifier
2-1-1.インストール
$ go install github.com/pcasteran/[email protected]
terraform graph の結果をパイプで渡す
terraform-graph-beautifier コマンドのオプションは、#installation | pcasteran/terraform-graph-beautifier: Terraform graph beautifier を参考に指定した。
$ terraform graph | terraform-graph-beautifier \
    --exclude="module.root.provider" \
    --output-type=cyto-html \
    > config1.html
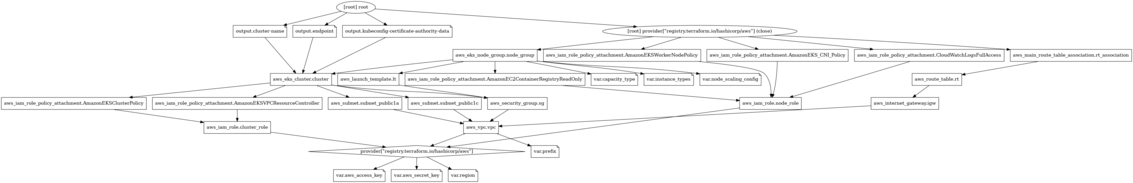
2-2.可視化した結果
左上にある “Collapse all”, “Expand all”, “Run layout” それぞれボタンを押すとリソースを縮小、拡大、異動させることができた。
3.Rover
im2nguyen/rover: Interactive Terraform visualization. State and configuration explorer.
3-1.使い方
Docker から使うのであれば、以下のようにワンライナーでok!
$ docker run --rm -it -p 9000:9000 -v $(pwd):/src im2nguyen/rover
2022/06/02 略 Starting Rover...
2022/06/02 略 Initializing Terraform...
2022/06/02 略 Generating plan...
2022/06/02 略 Generating resource overview...
2022/06/02 略 No submodule configurations found...
2022/06/02 略 Generating resource map...
2022/06/02 略 Generating resource graph...
2022/06/02 略 Done generating assets.
2022/06/02 略 Rover is running on 0.0.0.0:9000
※ Docker ホストの Terraform のバージョン非対応によるエラーを引くことがある。エラーメッセージに従って Terraform のバージョンを指定すればエラーは解消された。
$ docker run --rm -it -p 9000:9000 -v $(pwd):/src im2nguyen/rover
略 Unable to parse Plan: Unable to initialize Terraform Plan: terraform 1.1.2 not supported by configuration (= 1.1.7 required)
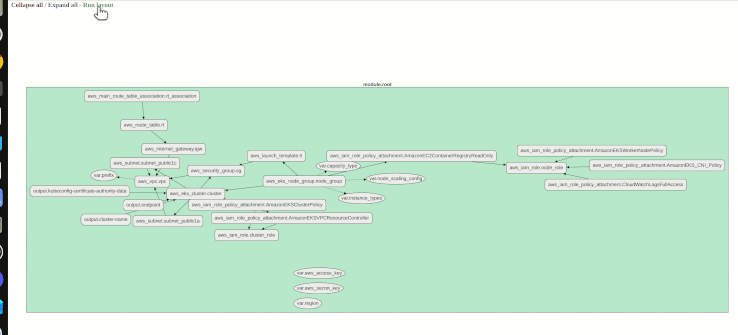
3-2.可視化した結果
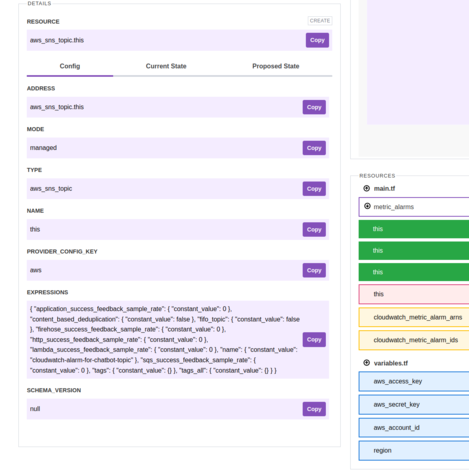
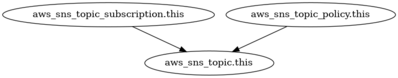
上部ではリソースの状態変化について色で教えてくれる
下部ではリソースの設定情報(Config)やリソースの現状(Current State)、apply されてからの想定される状態(Proposed State)が表示されている
4.Terraform Visual
hieven/terraform-visual: Terraform Visual is an interactive way of visualizing your Terraform plan
4-1.使い方
参考:#using-cli | hieven/terraform-visual
4-1-1.インストール
# グローバル
$ npm install -g @terraform-visual/cli

# ローカル。ここではローカルインストールをしたものとして進む。
$ npm i -D @terraform-visual/cli
4-1-2.plan.out という zip ファイルを生成し、そこに plan結果を格納
$ terraform plan -out=plan.out
略

Saved the plan to: plan.out

To perform exactly these actions, run the following command to apply:
    terraform apply "plan.out"
※ plan.out という zip ファイルを展開すると、plan というディレクトリが出てくる。
$ tree plan
plan
├── tfconfig
│   ├── m-
│   │   ├── main.tf
│   │   ├── terraform.tf
│   │   └── variables.tf
│   ├── m-metric_alarms
│   │   ├── main.tf
│   │   ├── outputs.tf
│   │   ├── variables.tf
│   │   └── versions.tf
│   └── modules.json
├── tfplan
├── tfstate
└── tfstate-prev

3 directories, 11 files
4-1-3.terraform show -json で plan.out (に格納されている plan/tfplan)を json 形式へ変換
$ terraform show -json plan.out > plan.json
4-1-4.plan.json を使って可視化
$  ./node_modules/.bin/terraform-visual --plan plan.json

outDirPath:   ${HPME}/your-terraform-project/terraform-visual-report
planFilePath: ${HPME}/your-terraform-project/plan.json

Report generated successfully!
Please run "open terraform-visual-report/index.html"
4-1-5.${HPME}/your-terraform-project/terraform-visual-report/index.html を開く
※ terraform-visual-report ディレクトリ以下に css らが用意されている
$ tree terraform-visual-report/
terraform-visual-report/
├── 404.html
├── index.html
├── _next
│   └── static
略
│       ├── css
略
└── plan.js

6 directories, 19 files
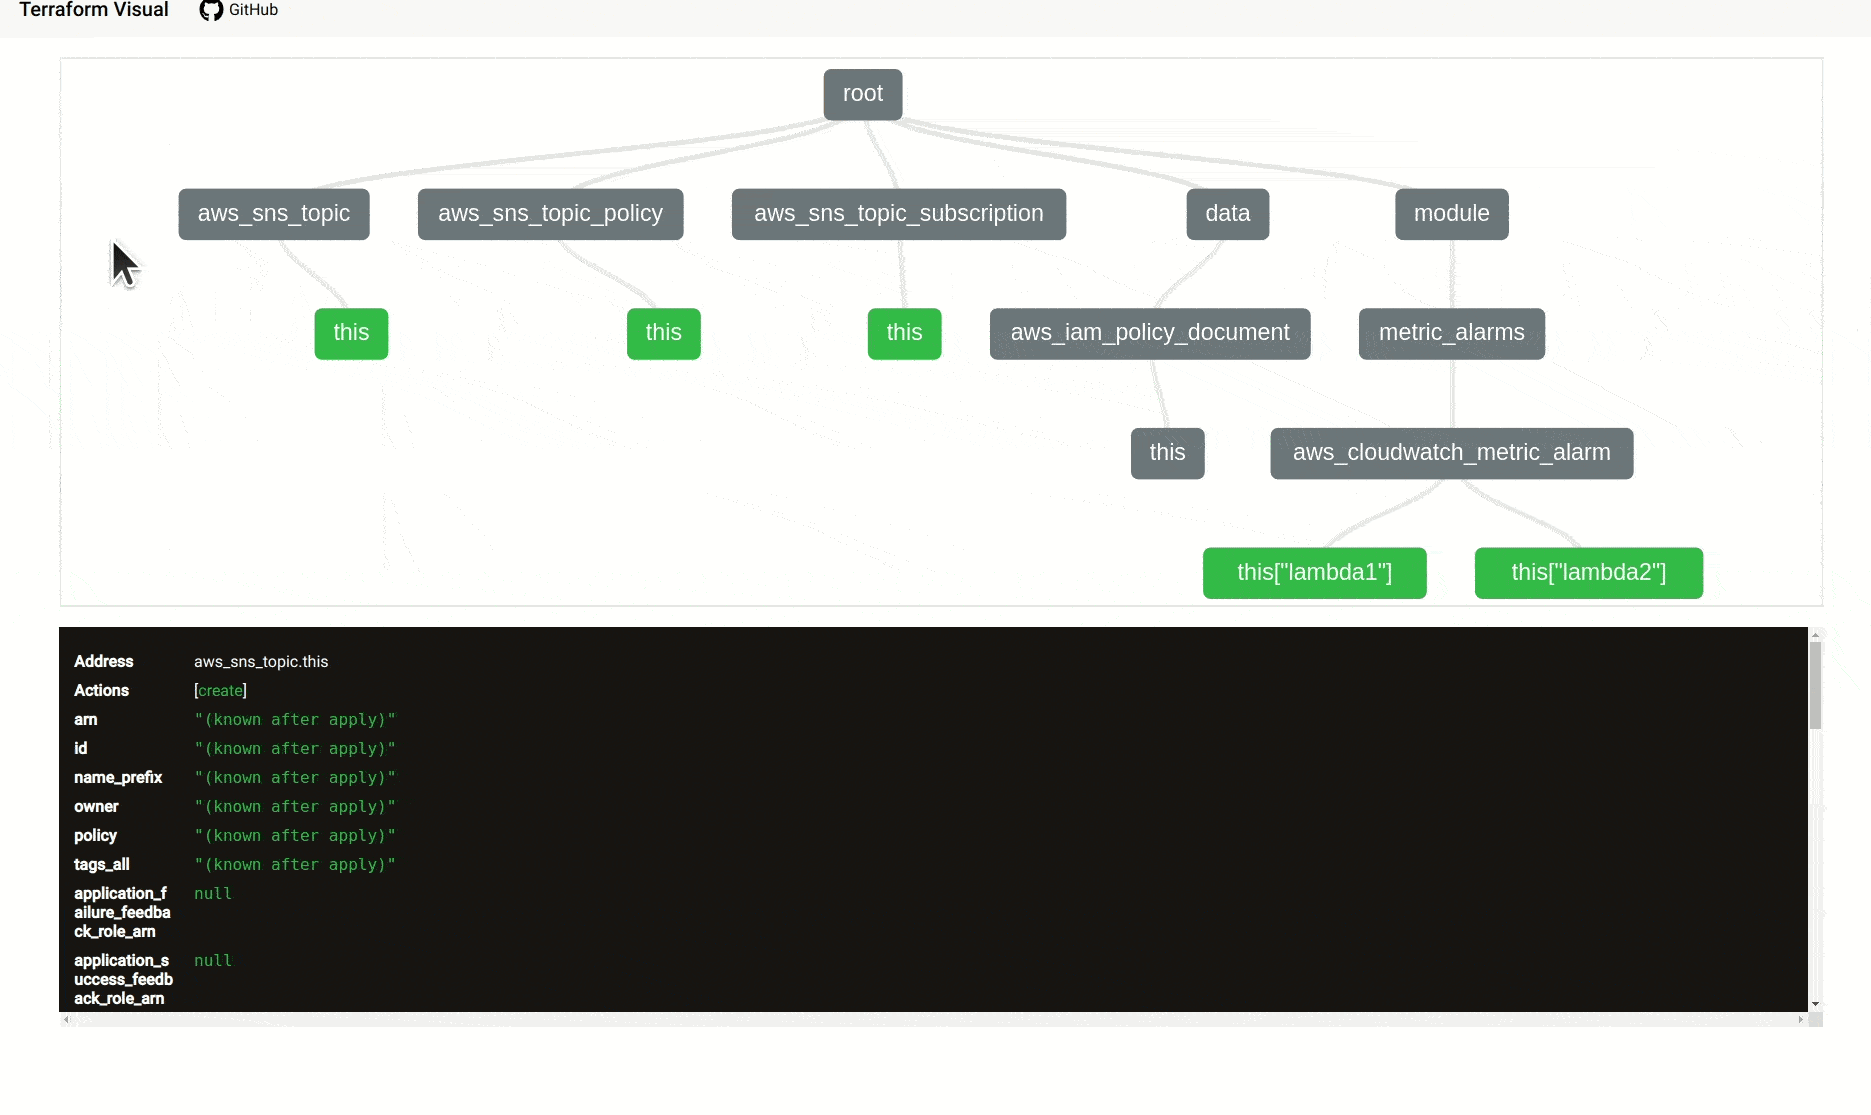
4-2.可視化した結果
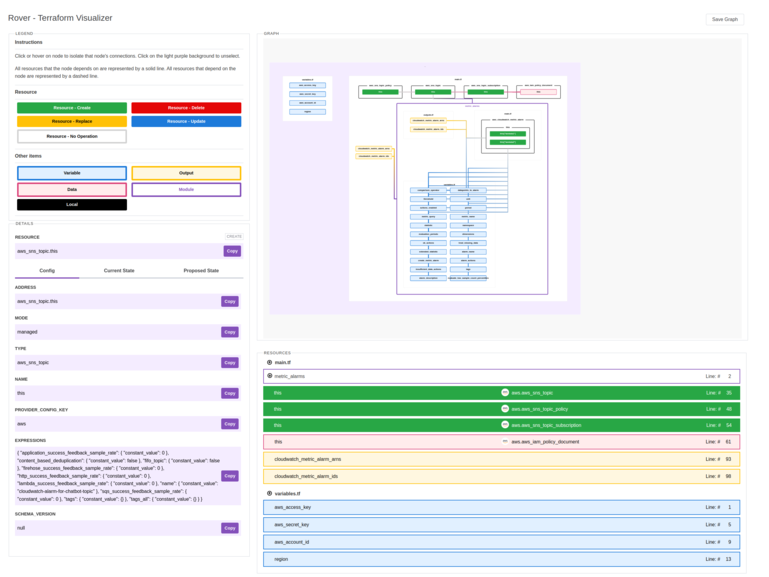
- 上部にインフラリソースの関係性が表現され、下部に planして表示される内容が出力されている
- グレーがリソース、緑がそのリソースの名前
- module を使っている場合も、それを使った結果どういうリソースが apply されるか教えてくれる
4-3.注意点
hieven/terraform-visual で案内されているとおり、Terraform Visual という Webサービスでもインフラリソースの可視化が出来るらしい。
ただし、plan.json には terraform.tfvars などで定義しているシークレットも書かれている ので、同 Web サービスにはアップロードしないほうがいい。ご自身のローカルでのみ実行することを強く勧める。
$ cat plan.json | jq -r '.variables | keys'
[
  "aws_access_key",
略
]
5.Inframap
5-1.使い方
参考:#example | cycloidio/inframap
go install でインストールして、inframap generate するだけ!
$ go install github.com/cycloidio/[email protected]
$ inframap generate terraform.tfstate --raw | dot -Tpng > inframapraw.png
5-2.可視化した結果
※ --raw オプションをつけないと画像が表示されなかった。これまで紹介したツールよりはうまく使うことができなかったという結果になってしまった。
$ inframap generate \
> terraform.tfstate --raw | \
> dot -Tpng > inframapraw.png
cf. #why-is-my-graph-generated-empty | cycloidio/inframap
6.参考
terraform graphのドキュメントterraform graphの代替ツール- pcasteran/terraform-graph-beautifier: Terraform graph beautifier
- im2nguyen/rover: Interactive Terraform visualization. State and configuration explorer.
- hieven/terraform-visual: Terraform Visual is an interactive way of visualizing your Terraform plan
- cycloidio/inframap: Read your tfstate or HCL to generate a graph specific for each provider, showing only the resources that are most important/relevant.